- Table View
- List View
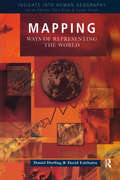
Mapping: Ways of Representing the World
by Daniel Dorling David FairbairnIllustrates how maps tell us as much about the people and the powers which create them, as about the places they show. Presents historical and contemporary evidence of how the human urge to describe, understand and control the world is presented through the medium of mapping, together with the individual and environmental constraints of the creator of the map.
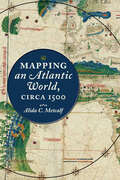
Mapping an Atlantic World, circa 1500
by Alida C. MetcalfBeginning around 1500, in the decades following Columbus's voyages, the Atlantic Ocean moved from the periphery to the center on European world maps. This brief but highly significant moment in early modern European history marks not only a paradigm shift in how the world was mapped but also the opening of what historians call the Atlantic World. But how did sixteenth-century chartmakers and mapmakers begin to conceptualize—and present to the public—an interconnected Atlantic World that was open and navigable, in comparison to the mysterious ocean that had blocked off the Western hemisphere before Columbus's exploration?In Mapping an Atlantic World, circa 1500, Alida C. Metcalf argues that the earliest surviving maps from this era, which depict trade, colonization, evangelism, and the movement of peoples, reveal powerful and persuasive arguments about the possibility of an interconnected Atlantic World. Blending scholarship from two fields, historical cartography and Atlantic history, Metcalf explains why Renaissance cosmographers first incorporated sailing charts into their maps and began to reject classical models for mapping the world. Combined with the new placement of the Atlantic, the visual imagery on Atlantic maps—which featured decorative compass roses, animals, landscapes, and native peoples—communicated the accessibility of distant places with valuable commodities. Even though individual maps became outdated quickly, Metcalf reveals, new mapmakers copied their imagery, which then repeated on map after map. Individual maps might fall out of date, be lost, discarded, or forgotten, but their geographic and visual design promoted a new way of seeing the world, with an interconnected Atlantic World at its center.Describing the negotiation that took place between a small cadre of explorers and a wider class of cartographers, chartmakers, cosmographers, and artists, Metcalf shows how exploration informed mapmaking and vice versa. Recognizing early modern cartographers as significant agents in the intellectual history of the Atlantic, Mapping an Atlantic World, circa 1500 includes around 50 beautiful and illuminating historical maps.
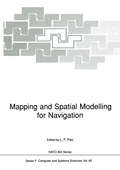
Mapping and Spatial Modelling for Navigation (NATO ASI Subseries F: #65)
by Louis F. PauThe successful implementation of applications in spatial reasoning requires paying attention to the representation of spatial data. In particular, an integrated and uniform treatment of different spatial features is necessary in order to enable the reasoning to proceed quickly. Currently, the most prevalent features are points, rectangles, lines, regions, surfaces, and volumes. As an example of a reasoning task consider a query of the form "find all cities with population in excess of 5,000 in wheat growing regions within 10 miles of the Mississippi River. " Note that this query is quite complex. It requires- processing a line map (for the river), creating a corridor or buffer (to find the area within 10 miles of the river), a region map (for the wheat), and a point map (for the cities). Spatial reasoning is eased by spatially sorting the data (i. e. , a spatial index). In this paper we show how hierarchical data structures can be used to facilitate this process. They are based on the principle of recursive decomposition (similar to divide and conquer methods). In essence, they are used primarily as devices to sort data of more than one dimension and different spatial types. The term quadtree is often used to describe this class of data structures. In this paper, we focus on recent developments in the use of quadtree methods. We concentrate primarily on region data. For a more extensive treatment of this subject, see [SameS4a, SameSSa, SameSSb, SameSSc, SameSga, SameSgbj.
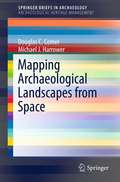
Mapping Archaeological Landscapes from Space (SpringerBriefs in Archaeology #5)
by Douglas C Comer Michael J. HarrowerMapping Archaeological Landscapes from Space offers a concise overview of air and spaceborne imagery and related geospatial technologies tailored to the needs of archaeologists. Leading experts including scientists involved in NASA’s Space Archaeology program provide technical introductions to five sections: 1) Historic Air and Spaceborne Imagery2) Multispectral and Hyperspectral Imagery3) Synthetic Aperture Radar4) Lidar5) Archaeological Site Detection and ModelingEach of these five sections includes two or more case study applications that have enriched understanding of archaeological landscapes in regions including the Near East, East Asia, Europe, Meso- and North America. Targeted to the needs of researchers and heritage managers as well as graduate and advanced undergraduate students, this volume conveys a basic technological sense of what is currently possible and, it is hoped, will inspire new pioneering applications. Particular attention is paid to the tandem goals of research (understanding) and archaeological heritage management (preserving) the ancient past. The technologies and applications presented can be used to characterize environments, detect archaeological sites, model sites and settlement patterns and, more generally, reveal the dialectic landscape-scale dynamics among ancient peoples and their social and environmental surroundings. In light of contemporary economic development and resultant damage to and destruction of archaeological sites and landscapes, applications of air and spaceborne technologies in archaeology are of wide utility and promoting understanding of them is a particularly appropriate goal at the 40th anniversary of the World Heritage Convention.
Mapping Biological Systems to Network Systems
by Heena RathoreThe book presents the challenges inherent in the paradigm shift of network systems from static to highly dynamic distributed systems – it proposes solutions that the symbiotic nature of biological systems can provide into altering networking systems to adapt to these changes. The author discuss how biological systems – which have the inherent capabilities of evolving, self-organizing, self-repairing and flourishing with time – are inspiring researchers to take opportunities from the biology domain and map them with the problems faced in network domain. The book revolves around the central idea of bio-inspired systems -- it begins by exploring why biology and computer network research are such a natural match. This is followed by presenting a broad overview of biologically inspired research in network systems -- it is classified by the biological field that inspired each topic and by the area of networking in which that topic lies. Each case elucidates how biological concepts have been most successfully applied in various domains. Nevertheless, it also presents a case study discussing the security aspects of wireless sensor networks and how biological solution stand out in comparison to optimized solutions. Furthermore, it also discusses novel biological solutions for solving problems in diverse engineering domains such as mechanical, electrical, civil, aerospace, energy and agriculture. The readers will not only get proper understanding of the bio inspired systems but also better insight for developing novel bio inspired solutions.
Mapping The Chinese And Islamic Worlds: Cross-cultural Exchange In Pre-modern Asia (pdf)
by Hyunhee ParkLong before Vasco da Gama rounded the Cape of Good Hope en route to India, the peoples of Africa, the Middle East, and Asia engaged in vigorous cross-cultural exchanges across the Indian Ocean. This book focuses on the years 700 to 1500, a period when powerful dynasties governed both regions, to document the relationship between the Islamic and Chinese worlds before the arrival of the Europeans. Through a close analysis of the maps, geographic accounts, and travelogues compiled by both Chinese and Islamic writers, the book traces the development of major contacts between people in China and the Islamic world and explores their interactions on matters as varied as diplomacy, commerce, mutual understanding, world geography, navigation, shipbuilding, and scientific exploration. When the Mongols ruled both China and Iran in the thirteenth and fourteenth centuries, their geographic understanding of each other's society increased markedly. This rich, engaging, and pioneering study offers glimpses into the worlds of Asian geographers and mapmakers, whose accumulated wisdom underpinned the celebrated voyages of European explorers like Vasco da Gama.
Mapping Europe's Borderlands: Russian Cartography in the Age of Empire
by Steven SeegelThe simplest purpose of a map is a rational one: to educate, to solve a problem, to point someone in the right direction. Maps shape and communicate information, for the sake of improved orientation. But maps exist for states as well as individuals, and they need to be interpreted as expressions of power and knowledge, as Steven Seegel makes clear in his impressive and important new book. Mapping Europe’s Borderlands takes the familiar problems of state and nation building in eastern Europe and presents them through an entirely new prism, that of cartography and cartographers. Drawing from sources in eleven languages, including military, historical-pedagogical, and ethnographic maps, as well as geographic texts and related cartographic literature, Seegel explores the role of maps and mapmakers in the East Central European borderlands from the Enlightenment to the Treaty of Versailles. For example, Seegel explains how Russia used cartography in the aftermath of the Napoleonic Wars and, later, formed its geography society as a cover for gathering intelligence. He also explains the importance of maps to the formation of identities and institutions in Poland, Ukraine, and Lithuania, as well as in Russia. Seegel concludes with a consideration of the impact of cartographers’ regional and socioeconomic backgrounds, educations, families, career options, and available language choices.

Mapping Forest Landscape Patterns
by Tarmo K. Remmel Ajith H. PereraThis book explores the concepts, premises, advancements, and challenges in quantifying natural forest landscape patterns through mapping techniques. After several decades of development and use, these tools can now be examined for their foundations, intentions, scope, advancements, and limitations. When applied to natural forest landscapes, mapping techniques must address concepts such as stochasticity, heterogeneity, scale dependence, non-Euclidean geometry, continuity, non-linearity, and parsimony, as well as be explicit about the intended degree of abstraction and assumptions. These studies focus on quantifying natural (i.e., non-human engineered) forest landscape patterns, because those patterns are not planned, are relatively complex, and pose the greatest challenges in cartography, and landscape representation for further interpretation and analysis.

Mapping Global Dynamics: Geographic Perspectives from Local Pollution to Global Evolution
by Gilbert AhamerThis book asks: What are the most suitable “mapping strategies” for detecting patterns of global dynamics?It adopts a spatial perspective when trying to understand “Global Dynamics” – and sets out to revolutionise the concept of space as such. Spatial views – on levels of increasing abstraction, reflection and self-organisation – are developed along eight case studies including air emissions, environmental radioactivity, deforestation, energy from biomass, land use change, food supply, water quality and cooperative interdisciplinary learning for global change.This book’s conceptual innovation consists in performing a transformation from “space & time” into “functional state space & evolutionary time” in order to better recognise the structural patterns of long-term global dynamics. A transdisciplinary readership in academia – including geography, philosophy, economics, global change and future research – that is interested in enlarging scientific concepts beyond classical borders – would be most welcome!

Mapping Innovation: The Discipline of Building Opportunity across Value Chains
by Mohab Anis Sarah Chawky Aya Abdel HalimThis book is an eye-opener for businesses unveiling how technology trends can be deployed to redesign products, services and processes. The authors provide business opportunities based on technological innovation across 10 industrial sectors in easy to read case studies. Each case study is a story that narrates the potential and influence of a technological innovation on an enterprise, by defining the challenges faced, the type of technology adopted, and the impact. Provides readers with compelling reasons for implementing technology trends in industrial value chains;Written in a simple, easy to read and exciting manner to be accessible to readers with different backgrounds and interests;Uses a single, structured paradigm in all the case studies.
Mapping It Out: Expository Cartography for the Humanities and Social Sciences (Chicago Guides to Writing, Editing, and Publishing)
by Mark MonmonierWriters know only too well how long it can take—and how awkward it can be—to describe spatial relationships with words alone. And while a map might not always be worth a thousand words, a good one can help writers communicate an argument or explanation clearly, succinctly, and effectively. In his acclaimed How to Lie with Maps, Mark Monmonier showed how maps can distort facts. In Mapping it Out: Expository Cartography for the Humanities and Social Sciences, he shows authors and scholars how they can use expository cartography—the visual, two-dimensional organization of information—to heighten the impact of their books and articles. This concise, practical book is an introduction to the fundamental principles of graphic logic and design, from the basics of scale to the complex mapping of movement or change. Monmonier helps writers and researchers decide when maps are most useful and what formats work best in a wide range of subject areas, from literary criticism to sociology. He demonstrates, for example, various techniques for representing changes and patterns; different typefaces and how they can either clarify or confuse information; and the effectiveness of less traditional map forms, such as visibility base maps, frame-rectangle symbols, and complementary scatterplot designs for conveying complex spatial relationships. There is also a wealth of practical information on map compilation, cartobibliographies, copyright and permissions, facsimile reproduction, and the evaluation of source materials. Appendixes discuss the benefits and limitations of electronic graphics and pen-and-ink drafting, and how to work with a cartographic illustrator. Clearly written, and filled with real-world examples, Mapping it Out demystifies mapmaking for anyone writing in the humanities and social sciences. "A useful guide to a subject most people probably take too much for granted. It shows how map makers translate abstract data into eye-catching cartograms, as they are called. It combats cartographic illiteracy. It fights cartophobia. It may even teach you to find your way."—Christopher Lehmann-Haupt, The New York Times

Mapping Latin America: A Cartographic Reader
by Karl Offen Jordana DymFor many, a map is nothing more than a tool used to determine the location or distribution of something—a country, a city, or a natural resource. But maps reveal much more: to really read a map means to examine what it shows and what it doesn’t, and to ask who made it, why, and for whom. The contributors to this new volume ask these sorts of questions about maps of Latin America, and in doing so illuminate the ways cartography has helped to shape this region from the Rio Grande to Patagonia. In Mapping Latin America,Jordana Dym and Karl Offen bring together scholars from a wide range of disciplines to examine and interpret more than five centuries of Latin American maps.Individual chapters take on maps of every size and scale and from a wide variety of mapmakers—from the hand-drawn maps of Native Americans, to those by famed explorers such as Alexander von Humboldt, to those produced in today’s newspapers and magazines for the general public. The maps collected here, and the interpretations that accompany them, provide an excellent source to help readers better understand how Latin American countries, regions, provinces, and municipalities came to be defined, measured, organized, occupied, settled, disputed, and understood—that is, how they came to have specific meanings to specific people at specific moments in time. The first book to deal with the broad sweep of mapping activities across Latin America, this lavishly illustrated volume will be required reading for students and scholars of geography and Latin American history, and anyone interested in understanding the significance of maps in human cultures and societies.

Mapping Legal Innovation: Trends and Perspectives
by Antoine Masson Gavin RobinsonThe legal sector is being hit by profound economic and technological changes (digitalization, open data, blockchain, artificial intelligence ...) forcing law firms and legal departments to become ever more creative in order to demonstrate their added value. To help lawyers meet this challenge, this book draws on the perspectives of lawyers and creative specialists to analyze the concept and life cycle of legal innovations, techniques and services, whether related to legislation, legal engineering, legal services, or legal strategies, as well as the role of law as a source of creativity and interdisciplinary collaboration.

Mapping, Monitoring, and Modeling Land and Water Resources: Advanced Techniques Using Open Source Software
by Pravat Kumar Shit, Pulakesh Das, Gouri Sankar Bhunia, and Dipanwita DuttaThe wide range of challenges in studying Earth system dynamics due to uncertainties in climate change and complex interference from human activities is creating difficulties in managing land and water resources and ensuring their sustainable use. Mapping, Monitoring, and Modeling Land and Water Resources brings together real-world case studies accurately surveyed and assessed through spatial modeling. The book focuses on the effectiveness of combining remote sensing, geographic information systems, and R. The use of open source software for different spatial modeling cases in various fields, along with the use of remote sensing and geographic information systems, will aid researchers, students, and practitioners to understand better the phenomena and the predictions by future analyses for problem-solving and decision-making.
Mapping, Monitoring, and Modeling Land and Water Resources: Advanced Techniques Using Open Source Software
by Pravat Kumar Shit Pulakesh Das Gouri Sankar Bhunia Dipanwita DuttaThe wide range of challenges in studying Earth system dynamics due to uncertainties in climate change and complex interference from human activities is creating difficulties in managing land and water resources and ensuring their sustainable use. Mapping, Monitoring, and Modeling Land and Water Resources brings together real-world case studies accurately surveyed and assessed through spatial modeling. The book focuses on the effectiveness of combining remote sensing, geographic information systems, and R. The use of open source software for different spatial modeling cases in various fields, along with the use of remote sensing and geographic information systems, will aid researchers, students, and practitioners to understand better the phenomena and the predictions by future analyses for problem-solving and decision-making.
Mapping Nanotechnology Innovations and Knowledge: Global and Longitudinal Patent and Literature Analysis (Integrated Series in Information Systems #20)
by Hsinchun ChenThis book defines the application of Information Technology’s systematic and automated knowledge mapping methodology to collect, analyze and report nanotechnology research on a global basis. The result of these analyses is be a systematic presentation of the state of the art of nanotechnology, which will include basic analysis, content analysis, and citation network analysis of comprehensive nanotechnology findings across technology domains, inventors, institutions, and countries.
Mapping Nature across the Americas
by Kathleen A. Brosnan James R. AkermanMaps are inherently unnatural. Projecting three-dimensional realities onto two-dimensional surfaces, they are abstractions that capture someone’s idea of what matters within a particular place; they require selections and omissions. These very characteristics, however, give maps their importance for understanding how humans have interacted with the natural world, and give historical maps, especially, the power to provide rich insights into the relationship between humans and nature over time. That is just what is achieved in Mapping Nature across the Americas. Illustrated throughout, the essays in this book argue for greater analysis of historical maps in the field of environmental history, and for greater attention within the field of the history of cartography to the cultural constructions of nature contained within maps. This volume thus provides the first in-depth and interdisciplinary investigation of the relationship between maps and environmental knowledge in the Americas—including, for example, stories of indigenous cartography in Mexico, the allegorical presence of palm trees in maps of Argentina, the systemic mapping of US forests, and the scientific platting of Canada’s remote lands.